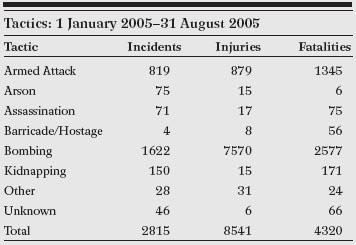
Overview of Tactics
出处:按学科分类—政治、法律 BERKSHIREPUBLISHINGGROUP《PatternsofGlobalTerrorism1985-2005:U.S.DepartmentofStateReportswithSupplementaryDocumentsandStatistics》第1009页(4149字)
Anna Sabasteanski
This set of graphs illustrates incidents, injuries and fatalities for the following tactics, for the years 1968-2004, plus data for January-July 2005: Armed attacks; Arson; Assassination; Barricade/Hostage; Bombing; Hijacking; Kidnapping; Other; Unconventional; and Unknown.
In the 1970s and 1980s, publicity generated by highprofile hijackings, often carried out by Palestinian groups, pushed this tactic to the forefront. Between 1968-2004 there were 233 hijackings, associated with 858 casualties. High levels of casualties were associated with only four incidents: A Malaysian jet in 1977; attacks by Abu Nidal and Hizballah in 1986, and an Ethiopian airline in 1996.
At this time, there were low levels of bomb attacks, but their number increased in the mid-1980s and grew rapidly from the mid-1990s, to become the preferred tactic and the leading source of death and injury. In the 27 years from 1968-1994, there were 4,503 incidents causing 15,031 injuries and 4,434 deaths (an average of 166 incidents per year, annually causing about 721 casualties). In the ten years from 1995 to 2004, there were 7,603 incidents (an average of 760 per year—more than two a day) causing 40,356 injuries and killing 9,087 (an average of nearly 5,000 casualties per year). Between January and August of 2005, there have been 1,622 attacks causing 7,570 injuries and killing 2,577.This dramatic increase in the level of violence is unprecedented.
Armed attacks are the second most lethal terrorist tactic. Between 1968 and 1994 1,021 incidents resulted in 2,692 casualties. In the following decade the numbers nearly doubled, with 2,110 armed attacks, causing 12,076 casualties. Armed attacks are not associated with mass casualties, with the dramatic exception of the 1995 Aum Shrinrikyo sarin nerve gas attack on the Tokyo subway system that killed 12 and injured 5,000.
Assassination comes third in the number of casualties it causes. From 1968 to 1994, 640 incidents resulted in 801 casualties. In the ten years from 1995 to 2004, 2,027 incidents caused 3,568 casualties.The peak year for assassinations was 2002, primarily involving South Asian government targets.
Until 2001 only one incident of barricade/hostage-taking—the siege of the Grand Mosque in Mecca—was associated with major casualties.. Since 2001 there have been numerous incidents, of which the most serious were two in Russia: the 2002 sieges of the Moscow and the Beslan schools.

Casualties associated with kidnapping remained low until 2002 when they began to spiked due to incidents in Colombia and Kashmir. Between 1968 and 1994, 701 incidents resulted in 45 injuries and 149 fatalities. From 1995 to 2004, the number of incidents rose to 851, involving 54 injuries and 476 fatalities. Arson is associated with fewer than 100 incidents per year. Only the Lord’s Resistance Army attack against refugees in 2004 resulted in mass casualties. Miscellaneous tactics include assaults, involvement of biological or chemical agents, crime, hoaxes, rioting, theft, and so forth. These are unusual and have produced few casualties, with the exception of 9/11 when airplanes were used as weapons.
The data for these graphs was retrieved from the National Counterterrorism Center’s (NCTC) Worldwide Incidents Tracking System (WITS) and the MIPT Terrorism Knowledge Base that integrates data from the RAND Terrorism Chronology and RAND-MIPT Terrorism Incident databases. NCTC’s methodology is described in full on the NCTC website, http://www.tkb.org/NCTCMethodology.jsp, which explains that most incidents can be coded with their taxonomy but “other kinds of attacks are more difficult to define. Incidents that involve multiple types of attack are especially problematic. Incidents involving mortars, rocket propelled grenades, and missiles generally fall under armed attack, although improvised explosive devices fall under bombing.”